CLIENT RESULTS
Campaign performance, shown clearly.
Explore selected Google Ads and Meta Ads campaign snapshots. Each example highlights the objective, recorded outcome and cost metrics visible in the source dashboard.
SELECTED PERFORMANCE
Google Ads, lead generation, messaging and sales campaigns
THE NUMBERS BEHIND THE WORK
Real dashboard snapshots. Clear campaign context.
These examples cover conversion, lead and messaging objectives across different budgets and reporting periods. Open any screenshot to inspect the original dashboard view.
Objective-led campaigns
Each campaign is measured against the action it was designed to produce.
Visible performance data
Core results and costs are transcribed directly from the supplied dashboards.
Responsible presentation
Campaign names are secondary to the metrics, and no future outcome is promised.
Lead and messaging campaign results
Seven snapshots showing the volume and recorded cost of Meta lead-generation and messaging activity.
Messaging campaign
01
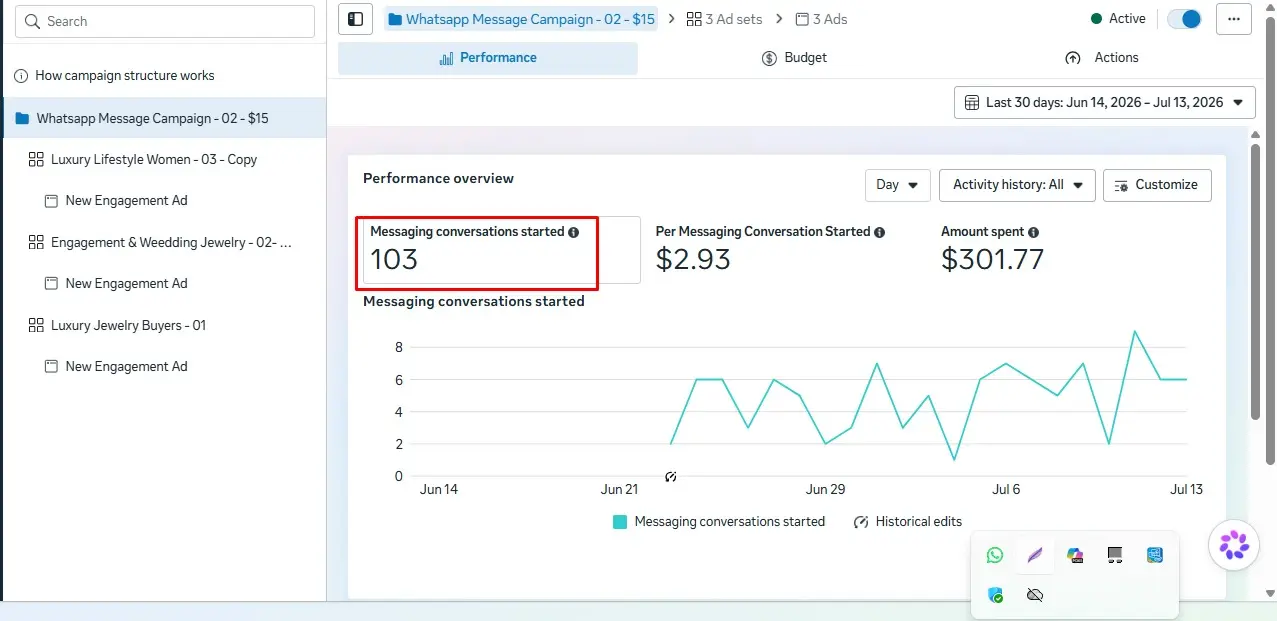
103 conversations started
103Conversations
$2.93Per conversation
$301.77Amount spent
 View full screenshot ↗
The dashboard records 103 messaging conversations started at an average of $2.93 per result.
Messaging campaign
02
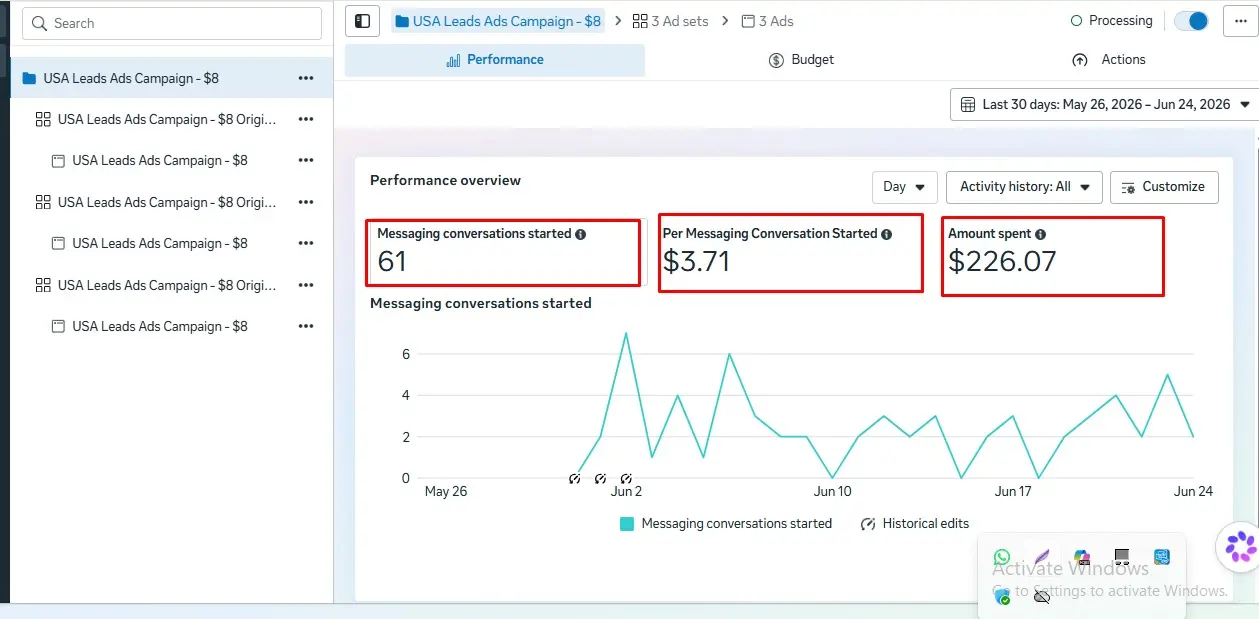
61 conversations started
61Conversations
$3.71Per conversation
$226.07Amount spent
 View full screenshot ↗
This campaign view shows 61 messaging conversations at a recorded average cost of $3.71 each.
Messaging campaign
03
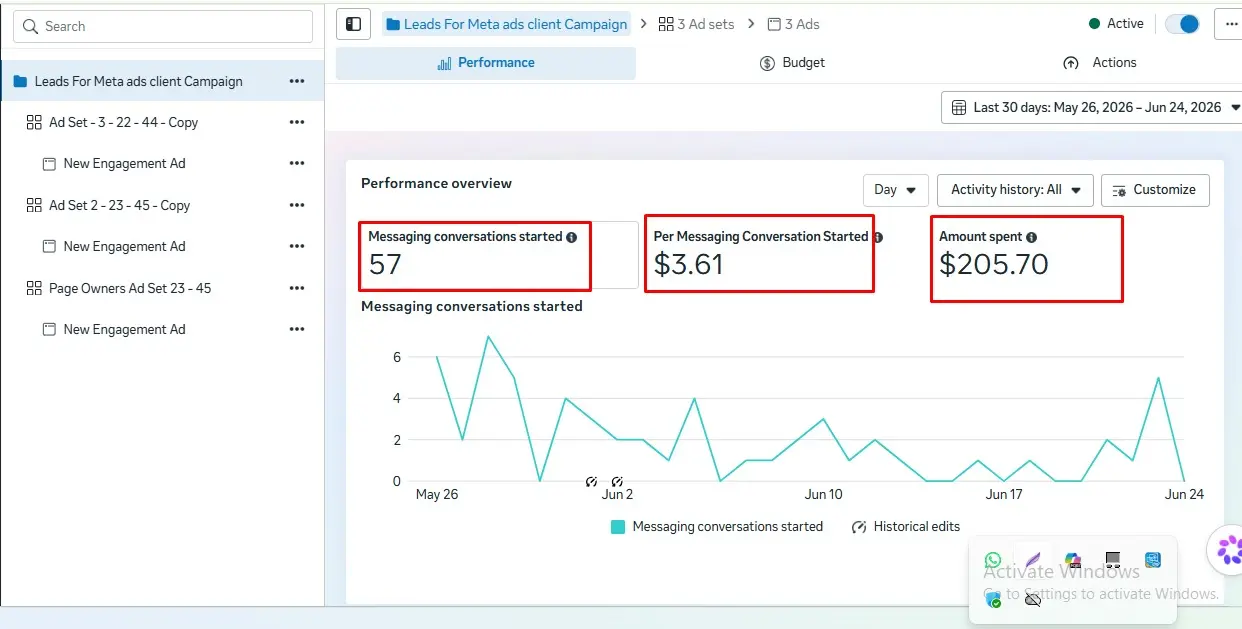
57 conversations started
57Conversations
$3.61Per conversation
$205.70Amount spent
 View full screenshot ↗
The selected reporting period records 57 messaging conversations at an average cost per result of $3.61.
Messaging campaign
04
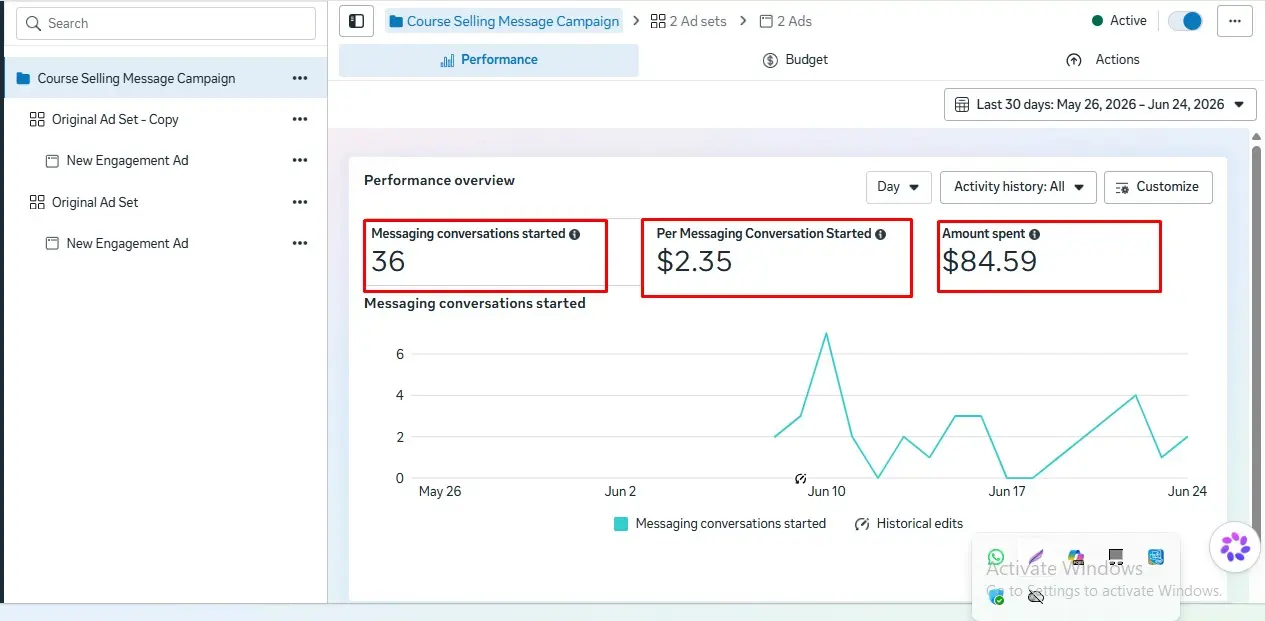
36 conversations started
36Conversations
$2.35Per conversation
$84.59Amount spent
 View full screenshot ↗
This snapshot shows 36 messaging conversations at a recorded average of $2.35 per conversation.
Messaging campaign
05
30 conversations started
30Conversations
$2.13Per conversation
$63.98Amount spent
 View full screenshot ↗
The dashboard records 30 messaging conversations at an average result cost of $2.13.
Messaging campaign
06
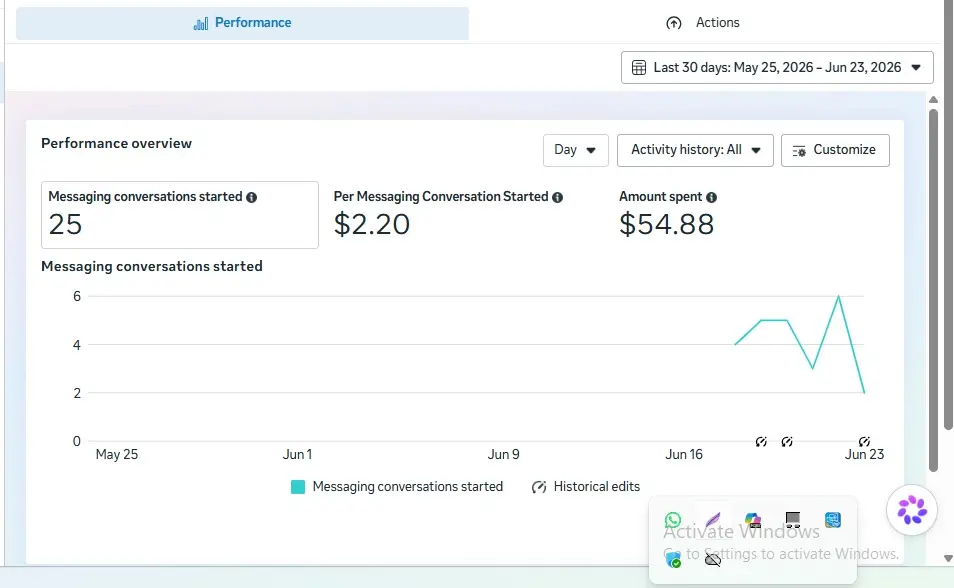
25 conversations started
25Conversations
$2.20Per conversation
$54.88Amount spent
 View full screenshot ↗
This campaign view shows 25 messaging conversations at a recorded average of $2.20 each.
Lead campaign
07
16 leads recorded
16Leads
$34.01Per lead
$544.18Amount spent
 View full screenshot ↗
The selected lead campaign records 16 leads at an average cost per result of $34.01.
GOOGLE ADS
Conversion performance at different scales
Nine campaign views showing lead volume, conversions, return on ad spend and recorded costs across different reporting periods.
Conversion campaign
01
6.74k conversions recorded
187kClicks
6.74kConversions
$91.25Cost / conversion
$616kRecorded cost
 View full screenshot ↗
This long-range dashboard view records 187k clicks and 6.74k conversions at an average cost per conversion of $91.25.
Conversion campaign
02
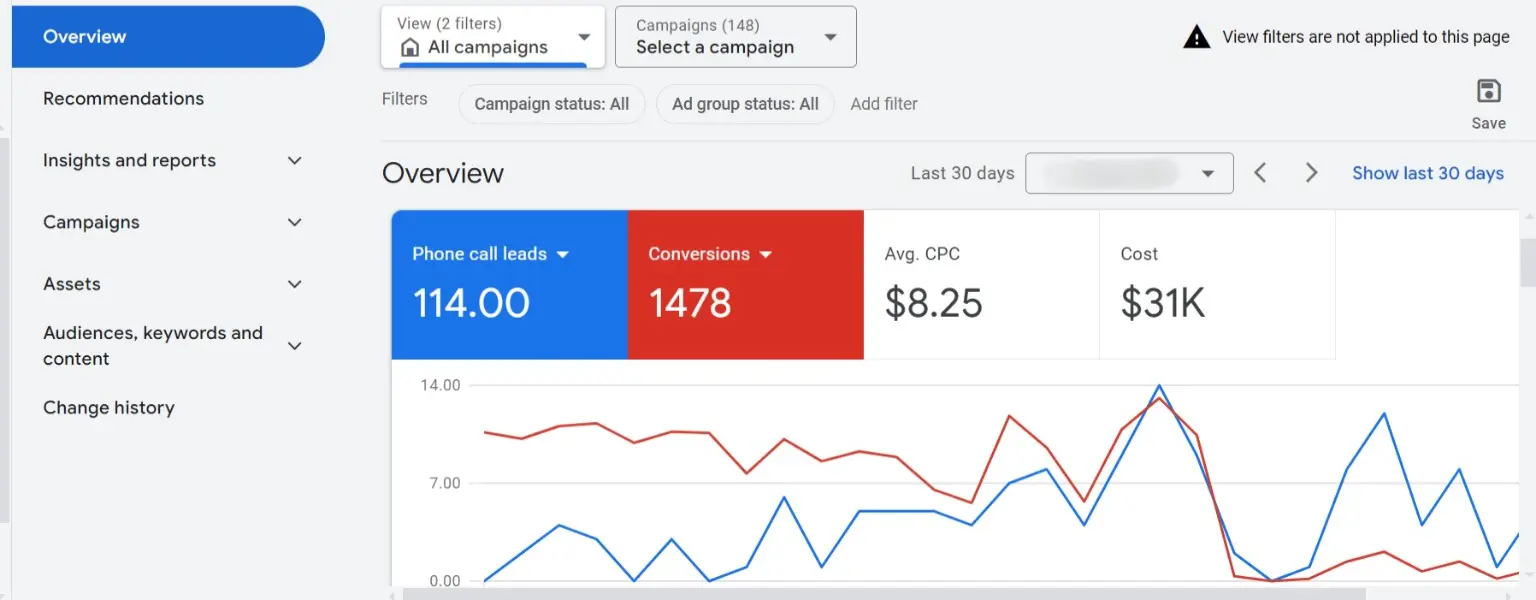
1,478 conversions recorded
114Phone-call leads
1,478Conversions
$8.25Average CPC
$31kRecorded cost
 View full screenshot ↗
The supplied 30-day dashboard records 1,478 conversions, including 114 phone-call leads, with an average cost per click of $8.25.
Lead-generation campaign
03
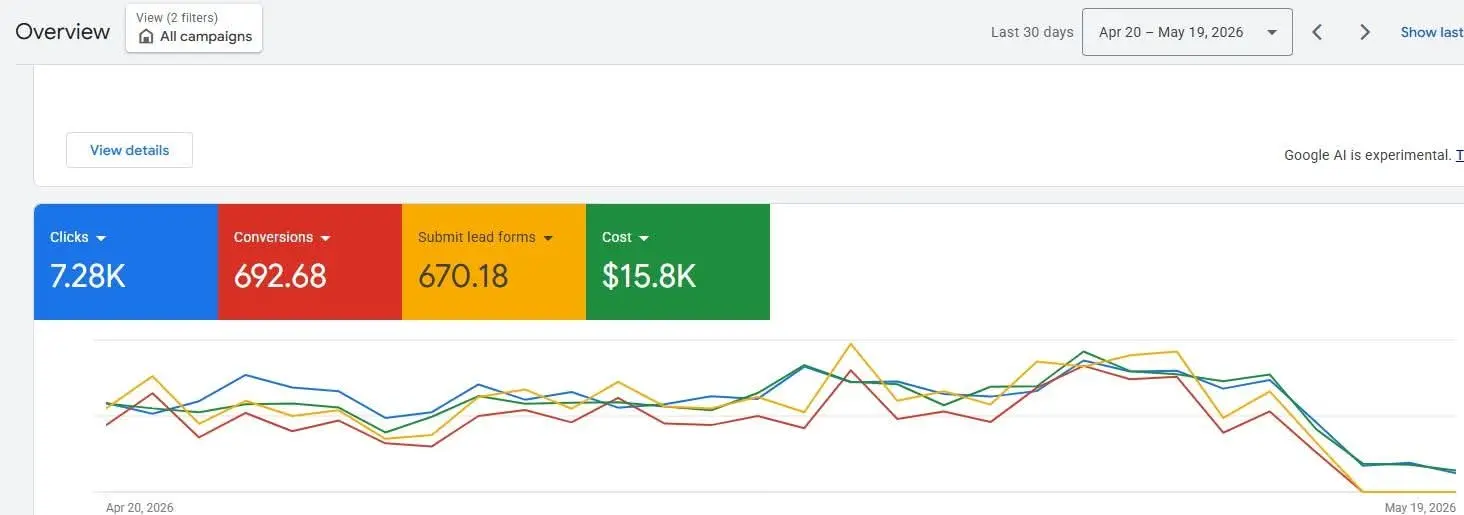
692.68 conversions recorded
7.28kClicks
692.68Conversions
670.18Lead forms
$15.8kRecorded cost
 View full screenshot ↗
This 30-day dashboard view shows 7.28k clicks, 692.68 attributed conversions and 670.18 submitted lead-form actions.
Sales campaign
04
462.71% actual ROAS
462.71%Actual ROAS
117.99Conversions
8.46kConversion value
$1.83kRecorded cost
 View full screenshot ↗
The selected sales-campaign period records 117.99 attributed conversions, 8.46k in conversion value and 462.71% actual return on ad spend.
Lead-generation campaign
05
157.33 conversions recorded
56Phone-call leads
101.33Lead forms
157.33Conversions
$20.4kRecorded cost
 View full screenshot ↗
This monthly campaign view records 56 phone-call leads and 101.33 submitted lead-form actions, totaling 157.33 attributed conversions.
Conversion campaign
06
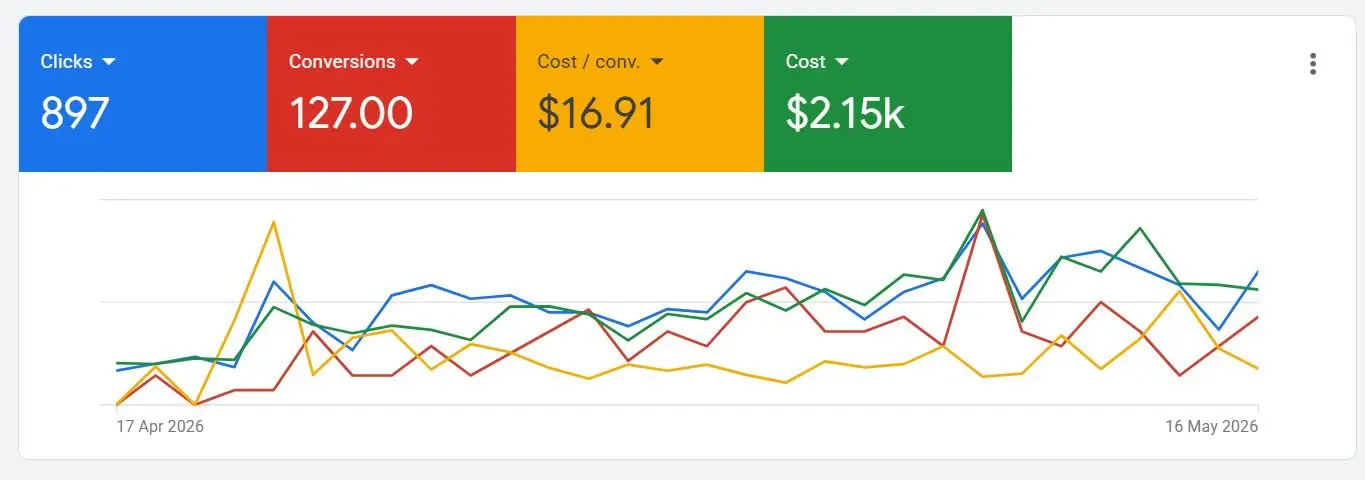
127 conversions recorded
897Clicks
127Conversions
$16.91Cost / conversion
$2.15kRecorded cost
 View full screenshot ↗
The dashboard period records 897 clicks and 127 conversions at an average cost per conversion of $16.91.
Conversion campaign
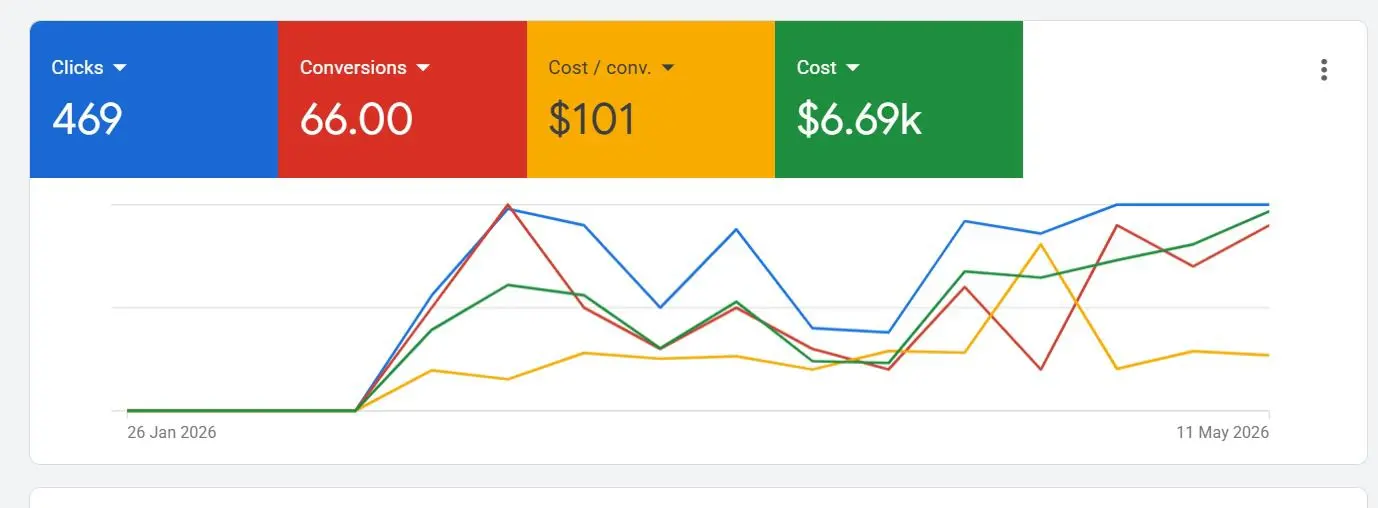
07
66 conversions recorded
469Clicks
66Conversions
$101Cost / conversion
$6.69kRecorded cost
 View full screenshot ↗
This dashboard view records 469 clicks and 66 conversions at an average cost per conversion of $101.
Lead-generation campaign
08
21 form leads and 28 call leads
310Clicks
21Lead forms
28Phone-call leads
$3.56kRecorded cost
 View full screenshot ↗
The selected 30-day lead campaign records 21 submitted lead forms and 28 phone-call leads from 310 clicks.
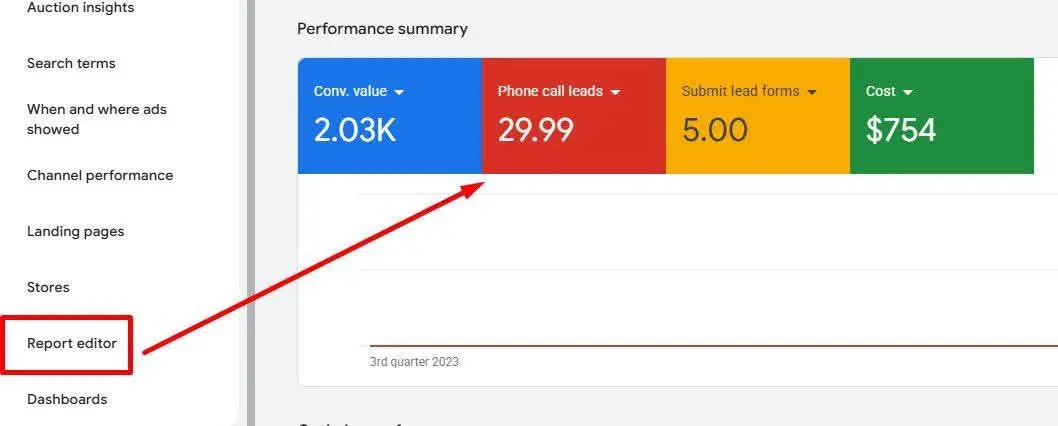
Lead-generation campaign
09
29.99 call leads on $754 spend
2.03kConversion value
29.99Phone-call leads
5Lead forms
$754Recorded cost
 View full screenshot ↗
This performance summary records 29.99 attributed phone-call leads and five submitted lead forms on $754 in recorded cost.
FROM DATA TO DECISIONS
The number is only useful when the next action is clear.
Define
Choose the right audience, offer, objective and conversion action.
Measure
Track the metrics that connect campaign activity to the business goal.
Improve
Use the data to refine targeting, creative, budget and follow-up.
Important: Results shown are from specific campaigns and reporting periods. Performance varies by industry, audience, offer, budget, creative, tracking and market conditions. These examples do not guarantee future results.
YOUR NEXT CAMPAIGN
Ready to build a measurable growth plan?
Share your goal, audience and current challenge. We will help you identify a practical next step.
